Analyzing network traffic with Wireshark in my cybersecurity lab
In this lab, I used Wireshark to capture and analyze network traffic between my MacBook and a Linux server, observing ICMP packets, SSH connections, TCP handshakes, and traffic generated by an Nmap scan.
In this DetonaDev Cyber Lab, I documented the use of Wireshark to capture and analyze network traffic between my MacBook and a Linux server.
In previous labs, I had already worked with SSH, authentication logs, and Nmap. Now, the goal was to observe what happens on the network while commands like ping, ssh, and nmap are executed.
The main idea was to move from the command view to the packet view:
ping  → generates ICMP traffic
ssh   → generates TCP connection on port 22
nmap  → generates TCP attempts to identify open ports
This lab was important to understand how network tools appear in captured traffic and how Wireshark can be used for analysis, diagnosis, and protocol study.
1. Lab objective
The objectives of this lab were:
- Open Wireshark on the MacBook;
- Identify the correct network interface;
- Apply capture and display filters;
- Capture ICMP traffic generated by the ping command;
- Capture SSH traffic between the MacBook and the Linux server;
- Identify the TCP three-way handshake;
- Observe traffic generated by an Nmap scan;
- Compare a normal connection with a port scan;
- Document the results securely.
2. Environment used
The lab was done using:
- MacBook as the source machine;
- Linux server as the target;
- Wireshark for packet capture;
- macOS Terminal to generate traffic;
- SSH for remote connection;
- Nmap for port scanning;
- Local network between the MacBook and the server.
The analyzed server was at the address:
192.168.1.78
And the MacBook was communicating with it through the Wi-Fi interface.
3. Opening Wireshark
First, I opened Wireshark on the MacBook.
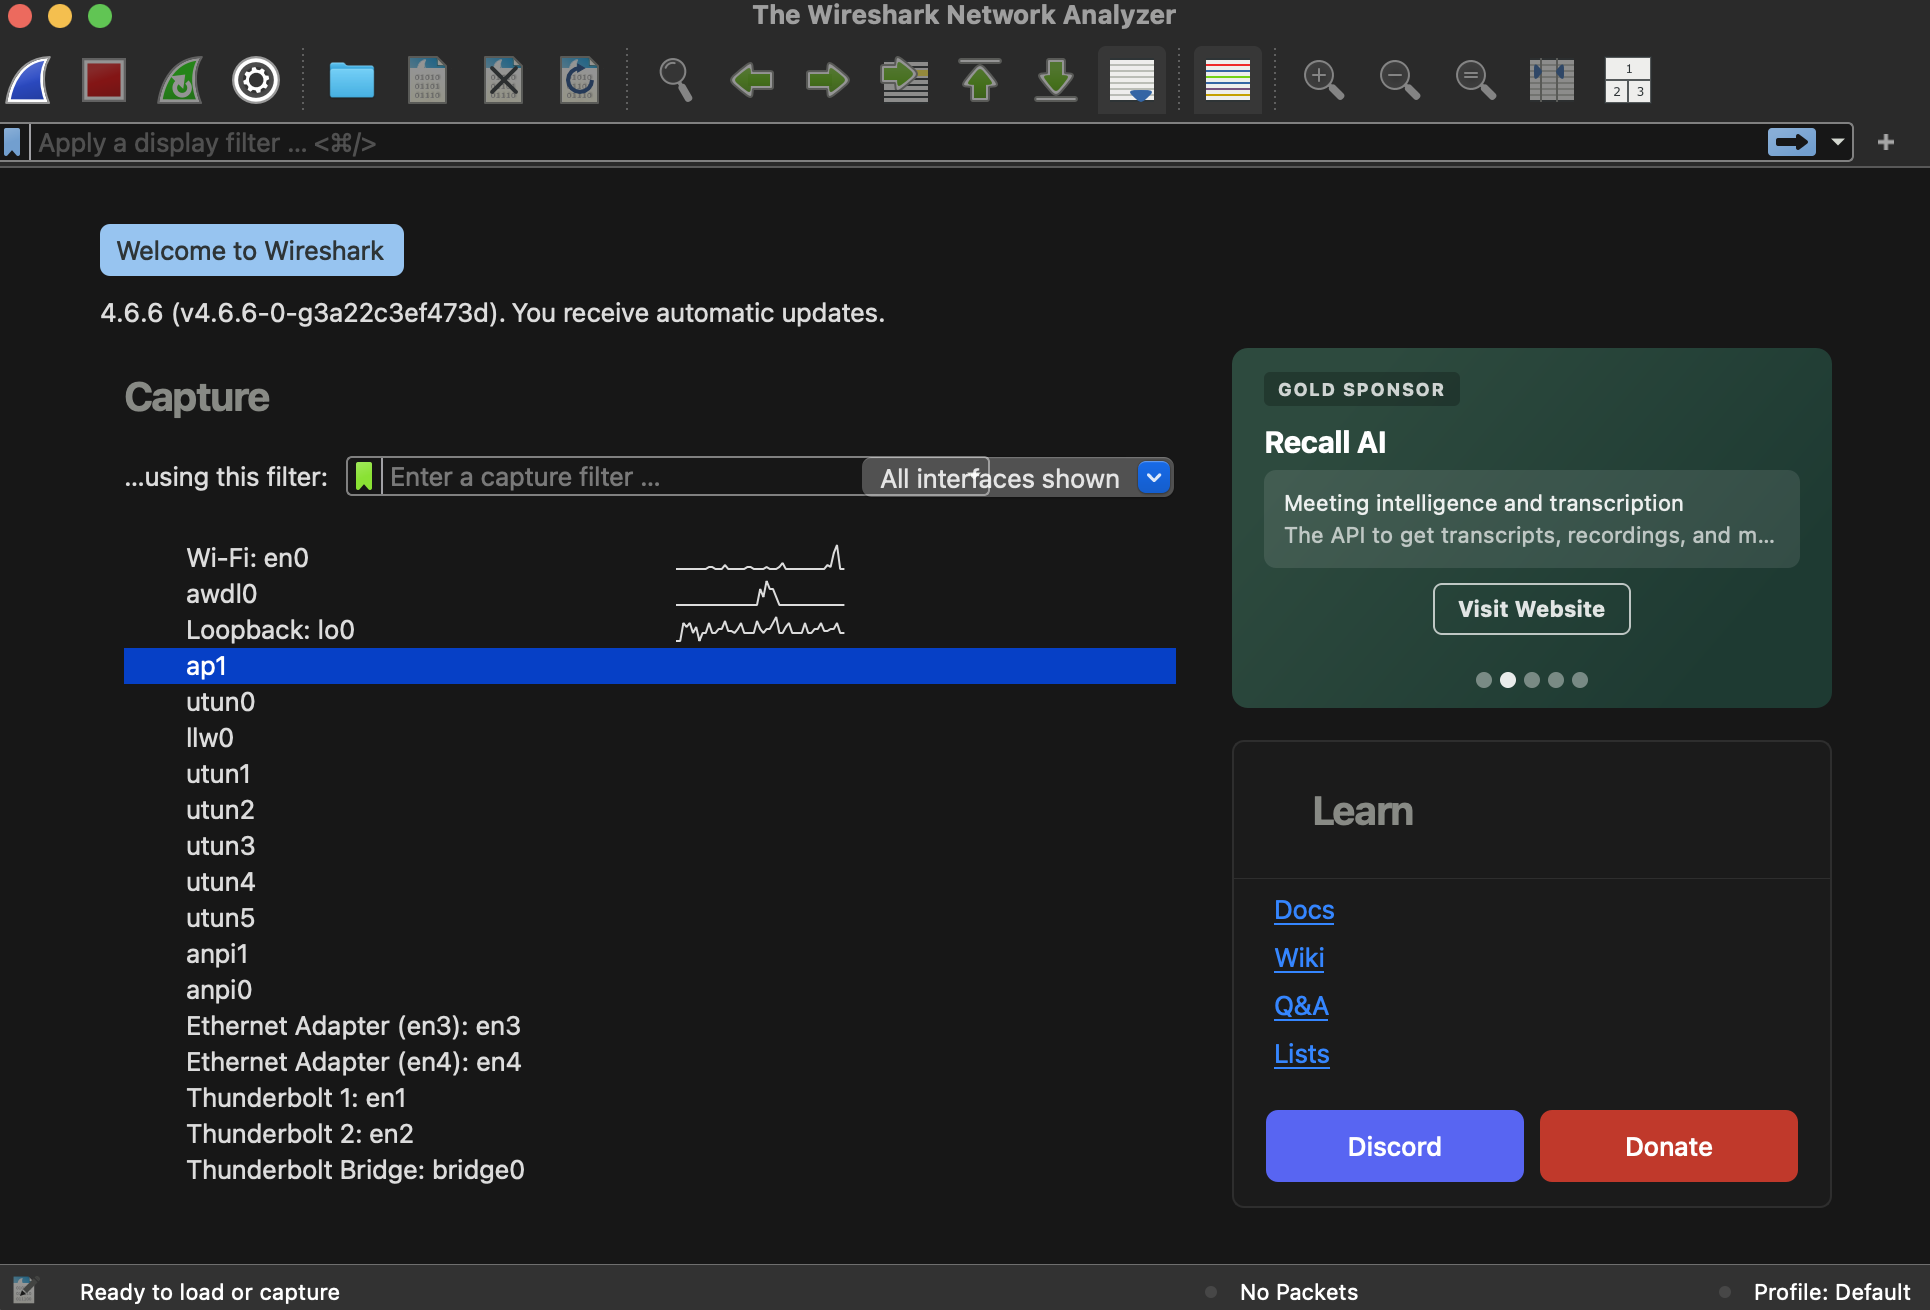
Wireshark lists the network interfaces available on the system. On the MacBook, the interface used for Wi-Fi usually appears as:
Wi-Fi: en0
This was the interface used in this lab.
4. Identifying the correct interface
Before starting the capture, I confirmed through the terminal which interface would be used to reach the Linux server.
On the MacBook, I executed:
route get 192.168.1.78

The result showed:
interface: en0
This confirmed that the capture should be done on the interface:
Wi-Fi: en0
This step is important because capturing on the wrong interface can cause Wireshark not to show the expected traffic.
5. Applying IP filter
With the capture started on the Wi-Fi: en0 interface, I applied the following filter in Wireshark:
ip.addr == 192.168.1.78
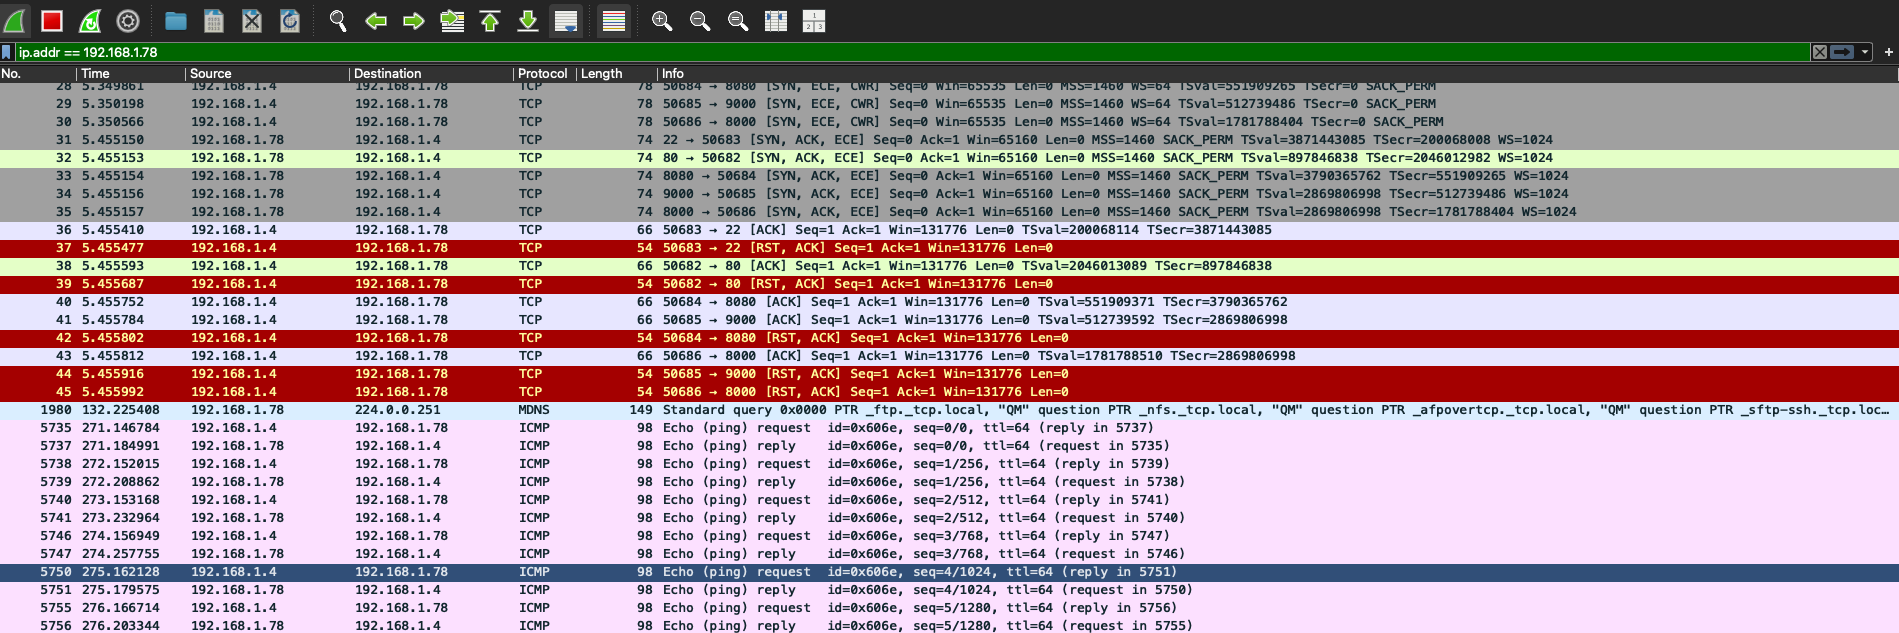
This filter shows only packets where the address 192.168.1.78 appears as source or destination.
In other words, it answers the question: Which packets are going to or coming from the server?
This type of filter helps reduce capture noise because many packets appear at the same time in a typical network.
6. Capturing ICMP traffic with ping
Next, I generated ICMP traffic using the ping command.
In the MacBook terminal, I executed:
ping 192.168.1.78
In Wireshark, I used the filter:
icmp && ip.addr == 192.168.1.78
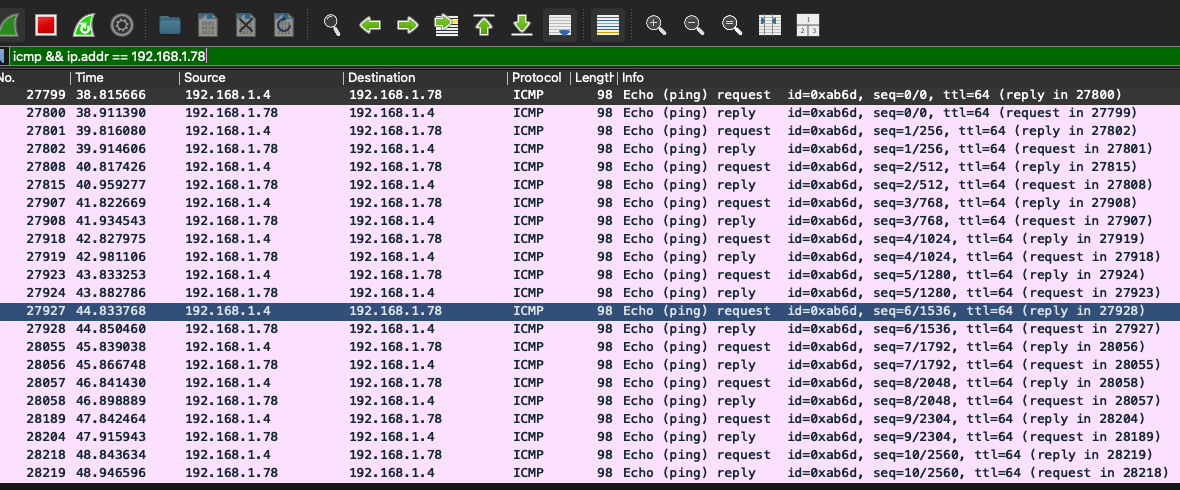
Wireshark showed packets of type:
Echo (ping) request
Echo (ping) reply
The logic is simple:
- Echo request = the MacBook asking if the server responds
- Echo reply = the server responding to the MacBook
Ping seems like a simple command, but behind the scenes, it generates ICMP packets between the machines.
This test confirmed two things:
- The MacBook could reach the server.
- Wireshark could capture this traffic.
7. Capturing SSH traffic
After analyzing ICMP, I captured the SSH traffic.
In Wireshark, I used the filter:
tcp.port == 22 && ip.addr == 192.168.1.78
This filter shows only TCP traffic on port 22 involving the server.
In the MacBook terminal, I connected via SSH:
ssh bruno-abreu@192.168.1.78
Then I executed some simple commands on the server and closed the session.
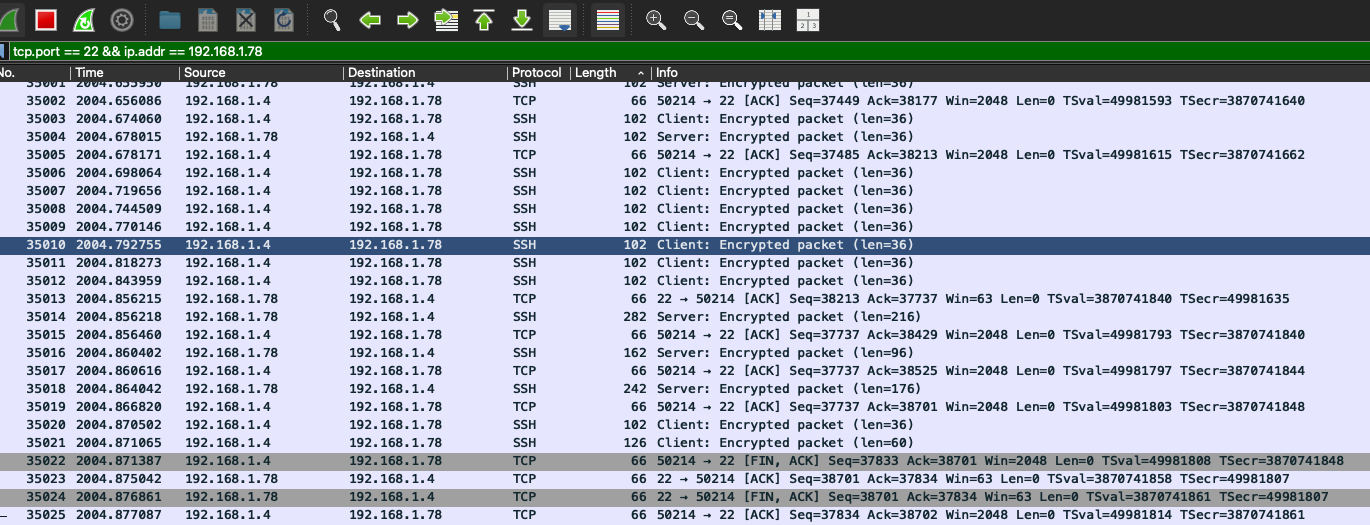
In Wireshark, packets like these appeared:
Client: Encrypted packet
Server: Encrypted packet
This point is very important. Wireshark can show:
- Source IP
- Destination IP
- Source port
- Destination port
- Protocol
- Packet size
- Communication direction
But it cannot read the contents of the SSH session, because SSH is encrypted.
That is: Wireshark sees that there is SSH communication, but it does not show the commands typed inside the session. This is exactly the expected behavior of a secure connection.
8. Understanding the TCP three-way handshake
Before an SSH session exchanges encrypted data, a TCP connection must first exist. This connection establishment happens in three stages:
- SYN
- SYN, ACK
- ACK
I captured a new SSH connection from the beginning to observe this process.
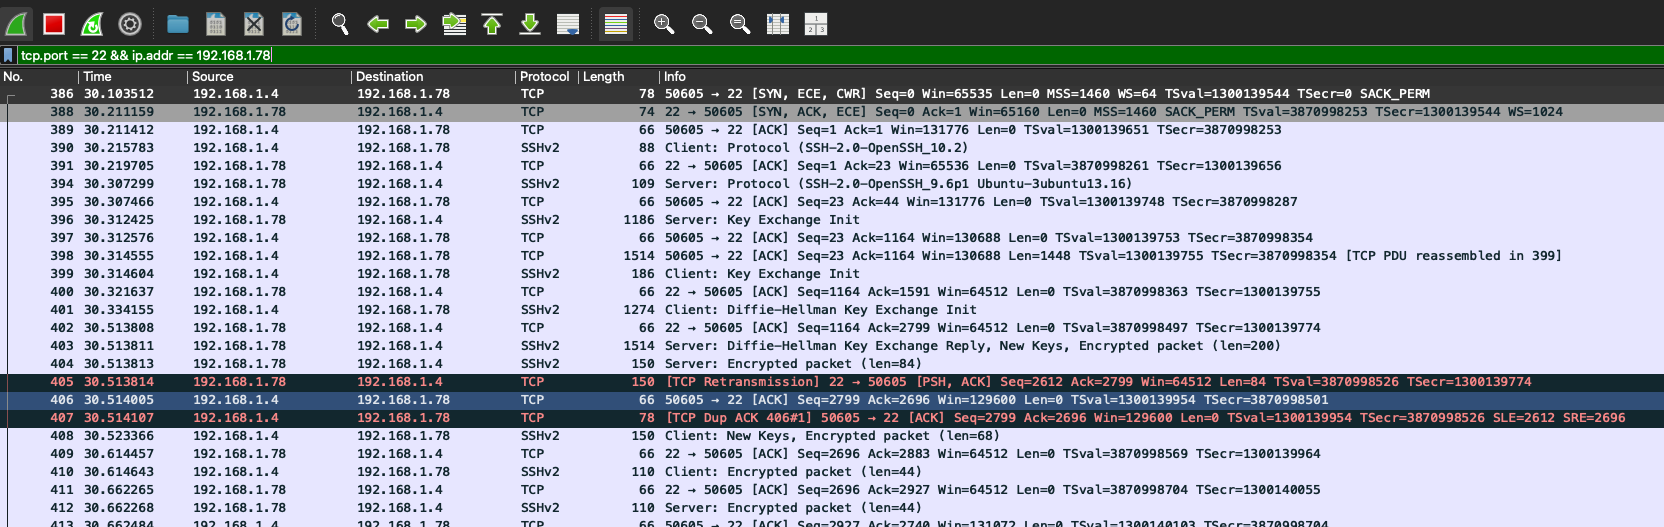
In the screenshot, you can see a sequence similar to:
MacBook → Server: SYN
Server → MacBook: SYN, ACK
MacBook → Server: ACK
In practical terms:
- SYN = the client asks to start a TCP connection
- SYN, ACK = the server responds accepting to start the connection
- ACK = the client confirms the connection
After this stage, messages related to SSH appear, such as:
Client: Protocol
Server: Protocol
Key Exchange Init
Encrypted packet
This shows that SSH depends first on an established TCP connection. This was one of the most important points of the lab because it connected network theory with a real capture.
9. Capturing traffic generated by Nmap
After observing a normal connection via SSH, I compared this behavior with a port scan using Nmap.
With Wireshark capturing, I executed on the MacBook:
nmap -p 22,80,8000,8080,9000 192.168.1.78
In Wireshark, I used the filter:
ip.addr == 192.168.1.78
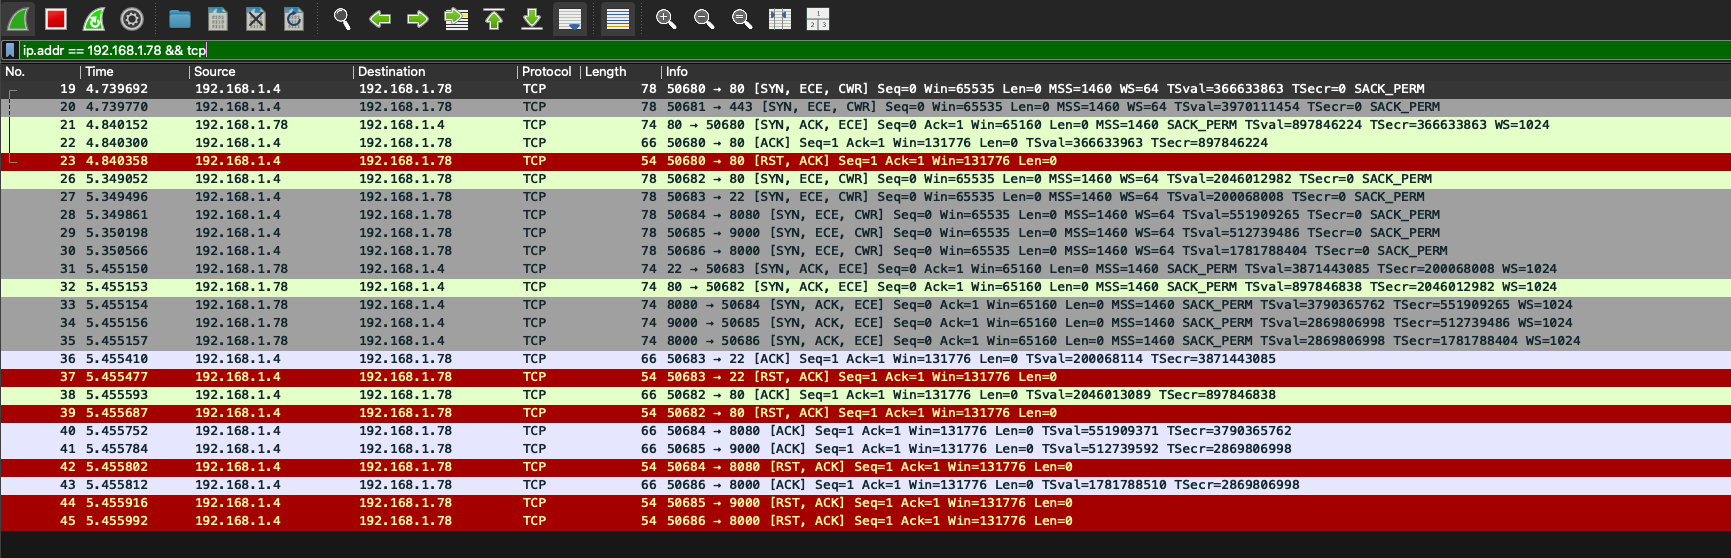
The capture showed several TCP attempts for different ports, such as: 22, 80, 8000, 8080, 9000.
This behavior is different from a normal SSH connection. An SSH connection tends to keep an active session and continuously exchange data. The Nmap scan, on the other hand, makes several quick attempts to check which ports respond.
In the capture, packets like these appear:
SYN
SYN, ACK
RST, ACK
This shows the port testing process. Simply put:
- SYN = attempt to start a connection
- SYN, ACK = the port responded
- RST, ACK = rapid closure of the attempt
This pattern is common in port scans because the tool doesn't need to maintain a long session. It only wants to find out if the port is open, closed, or filtered.
10. Difference between ping, SSH, and Nmap
By comparing the captures, it became easier to understand the difference between the types of traffic.
Ping
- Protocol: ICMP
- Objective: Test connectivity
- Example: Echo request / Echo reply
Ping answers the question: Does the server respond on the network?
SSH
- Protocol: TCP
- Port: 22
- Objective: Secure remote access
- Content: Encrypted
SSH answers the question: Can I open a secure session with the server?
Nmap
- Protocol: TCP
- Objective: Identify open ports
- Behavior: Several quick attempts to different ports
Nmap answers the question: Which ports are open or responding on this server?
This comparison was one of the most important parts of the lab.
11. What I learned in this lab
In this lab, I practiced important networking and security concepts:
- ICMP
- TCP
- SSH
- Nmap
- Wireshark
- Capture filters
- Three-way handshake
- TCP ports
- Encrypted traffic
- Packet analysis
I also better understood the difference between seeing a connection through the terminal and seeing that same connection at the packet level.
In the terminal, I see commands like:
ping 192.168.1.78
ssh bruno-abreu@192.168.1.78
nmap -p 22,80,8000,8080,9000 192.168.1.78
In Wireshark, I see what these commands generate on the network:
Echo request
Echo reply
SYN
SYN, ACK
ACK
Encrypted packet
RST, ACK
This view helps a lot to understand the real behavior of the protocols.
12. Precautions when using Wireshark
Wireshark is a powerful tool, but it must be used responsibly. Network captures can contain sensitive information, such as:
- IP addresses
- Device names
- Accessed domains
- Connection metadata
- Tokens or cookies in unencrypted traffic
- Internal application data
Therefore, in this lab, I used only my own environment and did not publish .pcapng files. For public documentation, the safest approach is to publish only controlled screenshots and review whether there is sensitive data on the screen.
13. Conclusion
In this lab, I used Wireshark to capture and analyze network traffic between my MacBook and a Linux server.
I started by identifying the correct network interface, applied IP filters, captured ICMP packets generated by ping, observed encrypted SSH traffic, identified the TCP three-way handshake, and compared a normal connection with traffic generated by an Nmap scan.
The main conclusion was:
The terminal shows the command. Wireshark shows what that command generates on the network.
This lab reinforced important fundamentals for cybersecurity, especially in areas like Blue Team, SOC, network security, and traffic analysis.
Understanding packets, ports, protocols, and connections is essential for investigating incidents, diagnosing problems, and understanding how systems communicate on a network.